Ethereum Price Prediction for Today, April 16: ETH May Consolidate at the $3,000 for a While
ETH May Consolidate at the $3,000 for a While – April 16
Sequent to a chain of declining-moving processes, the ETH/USD may consolidate at the $3,000 trading line for a while. The financial book records that the price is trading around $3,022, maintaining a minimal negative percentage rate of 0.61.
ETH May Consolidate at the $3,000 for a While: ETH Market
Key Levels:
Resistance levels: $3,250, $3,500, $3,750
Support levels: $2,750, $2,500, $2,250
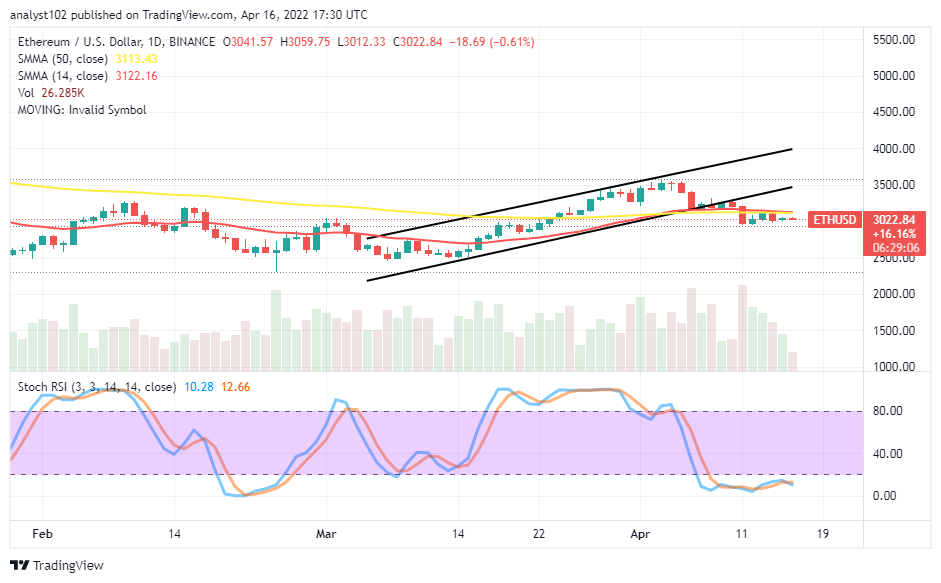
ETH/USD – Daily Chart
The daily chart showcases the ETH/USD market price may consolidate at the $3,000 for a while before running into a definite direction afterward. The conjoining of the 14-day SMA and the 50-day SMA trend lines closely above the value-line solidifies the analytic thought of the present trading condition. The Stochastic Oscillators are closer underneath the value-range line of 20, moving in a consolidation mode. And the current line of candlesticks formation signifies indecision is playing out.
Will the ETH/USD market decline more as the crypto’s price consolidate at the $3,000 level?
As it noticed that indecision is currently playing out at a lower trading spot outlook of the ETH/USD market operations, more free declines may not easily be observed in the near term as the crypto-economic price consolidates at the $3,000. Being as it is, long-position takers are to stay alerted to get a buying entry when an active move emanates from a downward-swinging motion underneath the conjoined spot of the SMAs.
On the downside of the technical analysis, the ETH/USD market short-position takers may not be having their new re-opening orders beneath the current psychological trading line at the $3,000. Some degrees of smaller-lows may occur, aiming to push the market into complete exhaustion of the last declining motion in the long-term run. But, getting the selling entry stands to be difficult when that scenario plays out.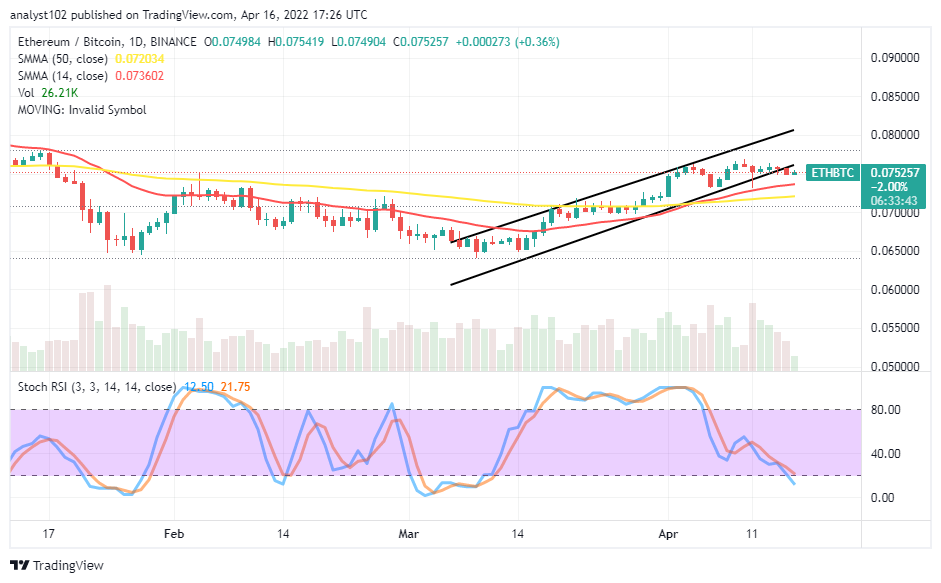
ETH/BTC Price Analysis
In comparison, Ethereum refuses to lose the momentum to Bitcoin at a high-trading zone above the SMA trend lines. The 14-day SMA indicator has slightly moved past the 50-day SMA indicator. And they are closely underneath the current featuring zone of the variant candlesticks representing several sessions in the past. The Stochastic Oscillators have somewhat slantingly bent southward briefly into the oversold region. At this point, a particular bearish candlestick needs to emerge against the smaller SMA to confirm the possibility of the base crypto falling further against the counter crypto economy in the subsequent sessions.
Looking to buy or trade Bitcoin (BTC) now? Invest at eToro!
68% of retail investor accounts lose money when trading CFDs with this provider.
Read more:
- How to buy Ethereum
- How to buy cryptocurrency
Powered by WPeMatico