Bitcoin Price Prediction for Today, April 16th: BTC Market Hovers Around $40,000
Bitcoin Price Prediction – April 16
Trading activities in the BTC/USD operation have been featured in a range-bound outlook as the crypto-economic market hovers around the $40,000 psychological level. Price is trading around $40,512, keeping a minimal negative percentage of 0.36.
BTC/USD Market
Key Levels:
Resistance levels: $42,500, $45,000, $47,500
Support levels: $37,500, $35,000, $32,500
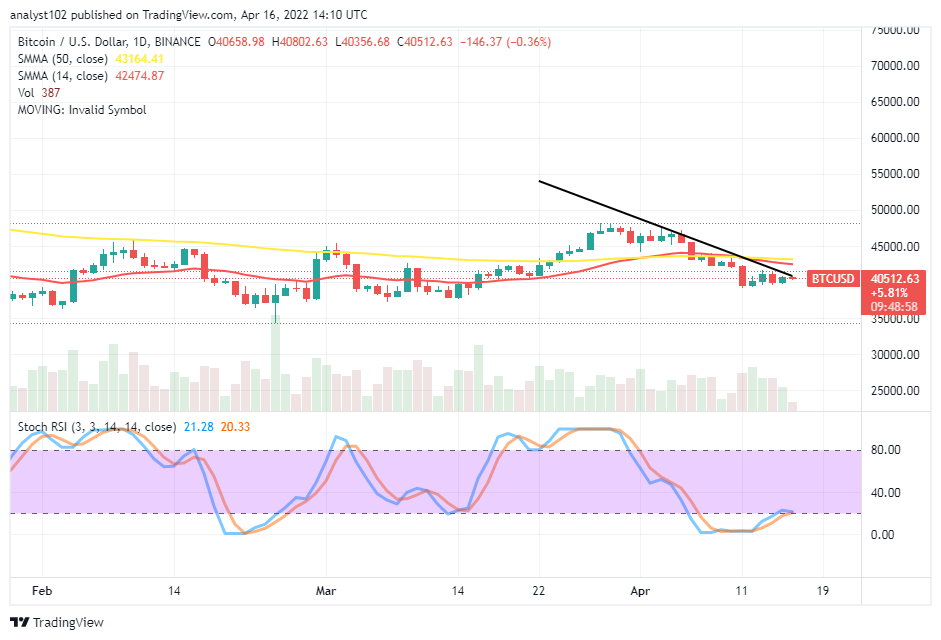
BTC/USD – Daily Chart
The BTC/USD daily chart reveals the crypto-economic market hovers Around the $40,000 trading level after a chain of notable swing lows. The 14-day SMA indicator has briefly intercepted the 50-day SMA indicator to the downside. And they are over the trading spot to denote a trading situation under a depression condition for the crypto business. The Stochastic Oscillators have briefly moved northbound within the oversold region to close their lines around the range20.
What is the trading situation like in the BTC/USD trade as the crypto market hovers Around the $40,000 level?
The trading situation in the BTC/USD trade operations suggests that a trait of indecision is ongoing in the long-term run as the crypto-economic market hovers around the $40,000 level. It would be necessary that a line of smaller-downs be allowed to occur against the value point mentioned to have a rebound to give buying entries in the process afterward. The $37,500 support line appears to be a critical level for getting ideal stances for the crypto’s price to make a comeback.
On the downside of the technical analysis, the BTC/USD market short-position placers have to affirm their efforts around the SMA trend lies closely beneath the $45,000 resistance trading level against any possible rebounding motion that can emanate from buyers’ actions afterward. A falling move will uphold past the $40,000 if bears consolidate their presence in the market for some time.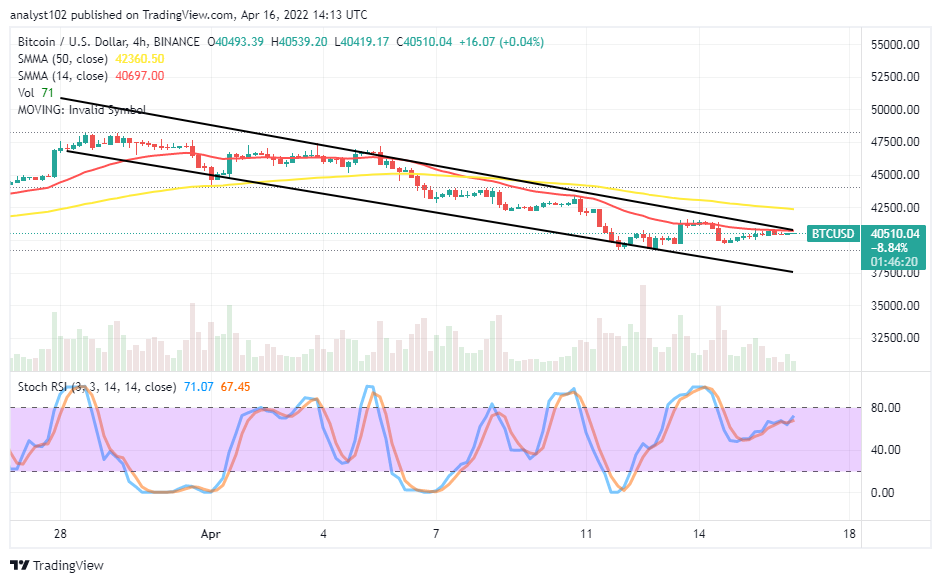
BTC/USD 4-hour Chart
The BTC/USD medium-term chart shows the crypto-economic market hovers around the upper bearish trend line. The 14-day SMA indicator tightly moves over variant psychological points to the downside underneath the 50-day SMA indicator. The Stochastic Oscillators are near below the range of 80, trying to join their lines together. That may be a sign against getting more upward forces freely in the near term. In the wake of that assumption, a drawdown may soon play out.
Looking to buy or trade Bitcoin (BTC) now? Invest at eToro!
68% of retail investor accounts lose money when trading CFDs with this provider.
Read more:
- How to buy Bitcoin
- How to buy cryptocurrency
Powered by WPeMatico