Bitcoin Price Prediction for Today April 13: BTC/USD Heads to $42,000 Level
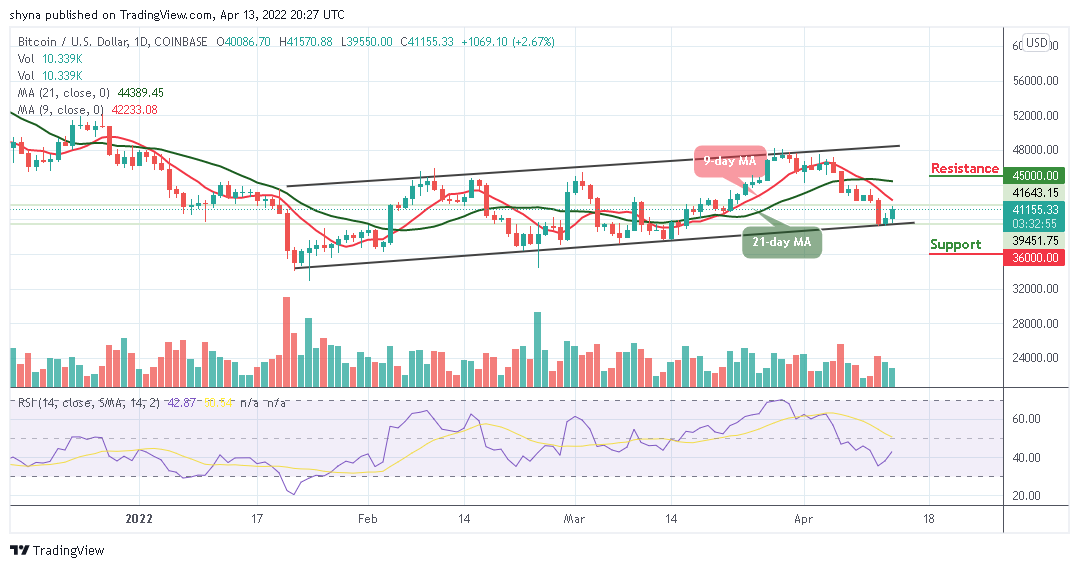
The Bitcoin price prediction retested the $39,550 support level as it is now rising, but it must stay above $42,000 for a steady increase.
BTC/USD Long-term Trend: Ranging (Daily Chart)
Key levels:
Resistance Levels: $45,000, $47,000, $49,000
Support Levels: $36,000, $34,000, $32,000
BTC/USD is currently recovering from the $39,550 support zone as the Bitcoin price needs to cross above the 9-day and 21-day moving averages to keep the uptrend intact. The daily chart reveals that traders could see that the king coin is yet to cross above the 9-day MA, and this could mean that the Bitcoin price may drop to retest the $40,000 support.
Bitcoin Price Prediction: Would Bitcoin Price Stay Higher?
As seen on the daily chart, the Bitcoin price is moving closer to the 9-day MA as the coin begins the new bullish movement with a new note. In the meantime, traders could see that the Bitcoin price has continued to converge above the key level of $41,000. The Relative Strength Index (14) moves to cross above 40-level in an attempt to probably cross back to the north. That signals that the return of a bullish uptrend may come to play.
However, the first major resistance is near the $42,000 level, therefore, a clear break above the $44,000 level could set the pace for a larger increase to $45,000, $47,000, and $49,000 resistance levels. On the contrary, if the Bitcoin price fails to clear the $42,000 resistance, it could start a new decline as the initial support on the downside is near the $46,000 level. If there is a downside break below the $40,000 support and $38,000, the price could see a sharp decline towards the support levels of $36,000, $34,000, and $32,000 respectively.
BTC/USD Medium-Term Trend: Ranging (4H Chart)
The 4-hour chart for BTC shows that the coin is likely to follow a sideways movement. However, the Bitcoin price is currently crossing above the 9-day and 21-day moving averages. Any further bullish movement could hit the key resistance level at $44,000 and above.
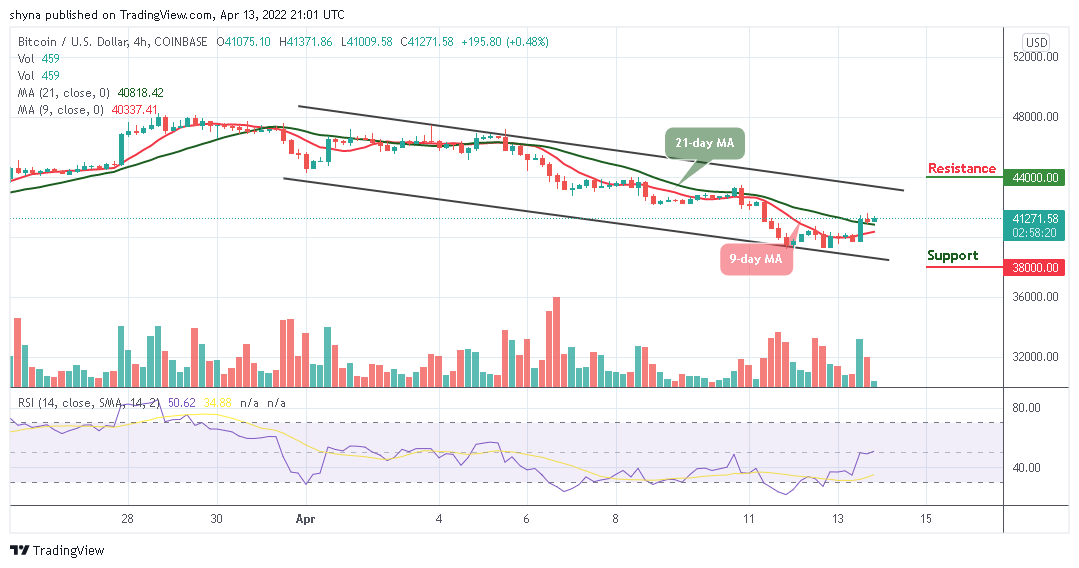
However, considering that the 9-day MA is still below the 21-day MA, the Bitcoin price may move back below the $40,000 support. A cross below the lower boundary of the channel may further bring the BTC price to the support level of $38,000 and below. However, the technical indicator Relative Strength Index (14) moves in the same direction, which indicates sideways movement.
Looking to buy or trade Bitcoin (BTC) now? Invest at eToro!
68% of retail investor accounts lose money when trading CFDs with this provider
Read more:
- How to buy Bitcoin
- How to buy Cryptocurrency
Powered by WPeMatico