Bitcoin Price Prediction for Today April 12: BTC/USD Retraces Below $40,000
The Bitcoin price prediction continues with its price slumps close to the lower boundary of the channel as the coin heads to the south.
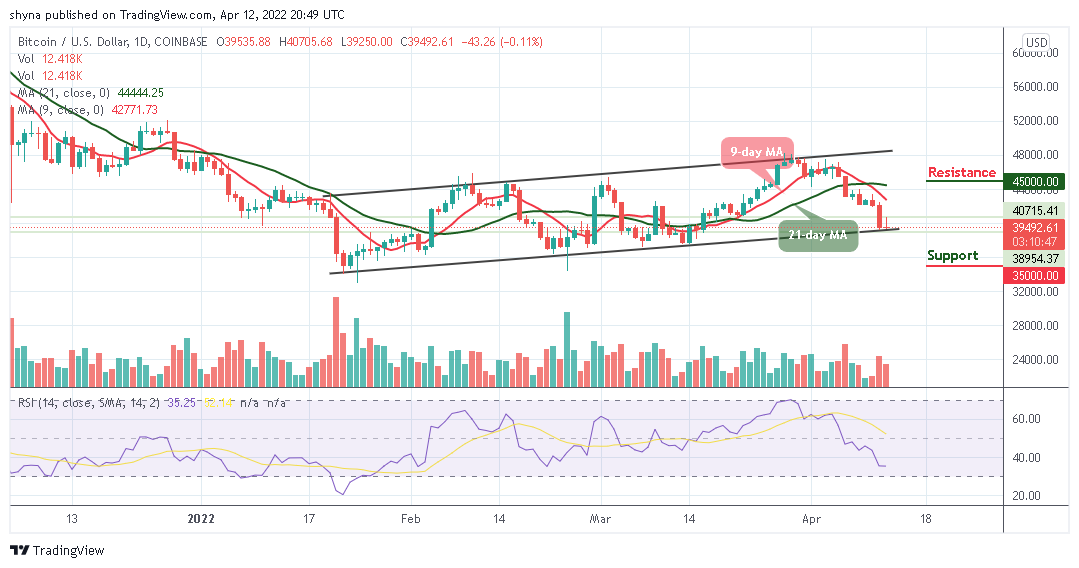
BTC/USD Long-term Trend: Ranging (Daily Chart)
Key levels:
Resistance Levels: $45,000, $47,000, $49,000
Support Levels: $35,000, $33,000, $31,000
At the time of writing, BTC/USD is hovering at $39,492. There have been instances when BTC has exchanged hands below $39,500 sustaining the bearish price action is a downhill task. With the look of things, the path of least resistance is still downwards. Meanwhile, looking at the daily chart shows the formation of a bearish pennant pattern.
Bitcoin Price Prediction: BTC Fails at Critical Resistance, $35,000 Support Incoming?
Looking at the technical indicator Relative Strength Index (14) is nose-diving towards the south; whereas, the Bitcoin price is not yet done with the downside. With the drop suffered, the technical indicators are all facing the downside. This could mean that there may still be a room that could be explored by the bears. Meanwhile, the Bitcoin price may continue to follow the downtrend in as much as the king coin remains below the 9-day and 21-day moving averages.
On the upside, recovery may not come easy. the support will have to be sorted for above the 9-day and 21-day moving averages. Meanwhile, a sustainable move above this barrier could be located around $43,500, which may negate the bearish scenario and allow for an extended recovery towards the resistance levels at $45,000, $47,000, and $49,000. However, an increase in selling pressure across the market could force the Bitcoin price towards a painful path and through various tentative supports at $35,000, $33,000, and $31,000.
BTC/USD Medium-Term Trend: Bearish (4H Chart)
According to the 4-hour chart, the Bitcoin price keeps trading below the 9-day and 21-day moving averages. BTC/USD has just survived the $39,000 support as the market resumes upside momentum. However, the first digital asset is likely to return to the bull market if the price breaks above the $40,000 level. Meanwhile, higher resistance is located at the $41,500, and as the technical indicator Relative Strength Index (14) prepares to leave the oversold region.
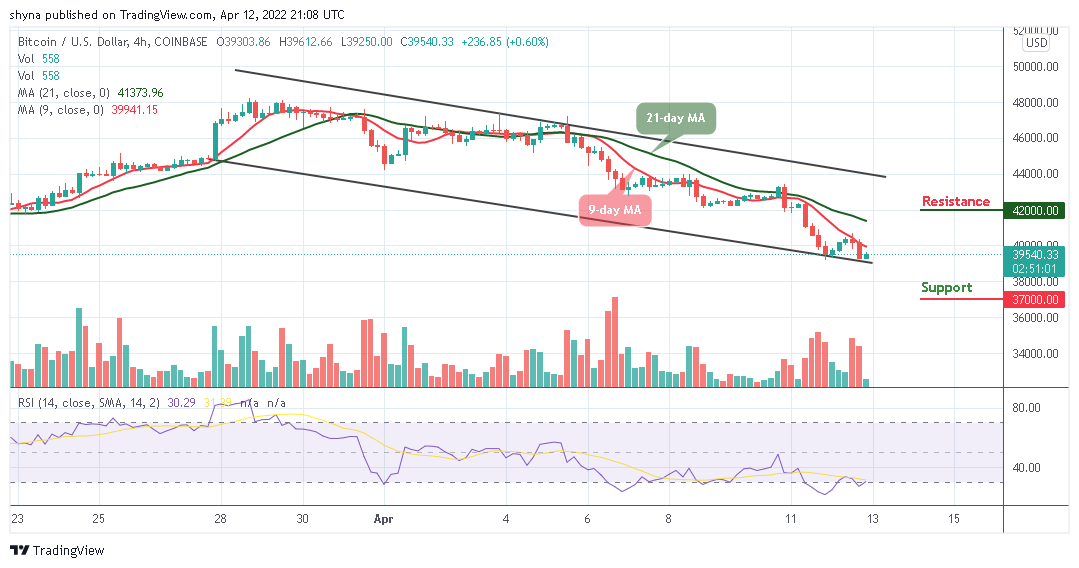
On the other hand, if the bearish movement continues, the support level of $38,000 may not be able to hold the selling pressure. More so, BTC/USD is likely to fall to $37,000 and below if the price falls below the lower boundary of the channel.
Looking to buy or trade Bitcoin (BTC) now? Invest at eToro!
68% of retail investor accounts lose money when trading CFDs with this provider
Read more:
- How to buy Bitcoin
- How to buy Cryptocurrency
Powered by WPeMatico