Bitcoin Price Prediction: BTC/USD Stays Above $43,000 Resistance Level
Bitcoin Price Prediction – April 10
The Bitcoin price prediction gains 0.93% as bulls keep working hard to nurture a bullish trend from the opening price of $42,766.
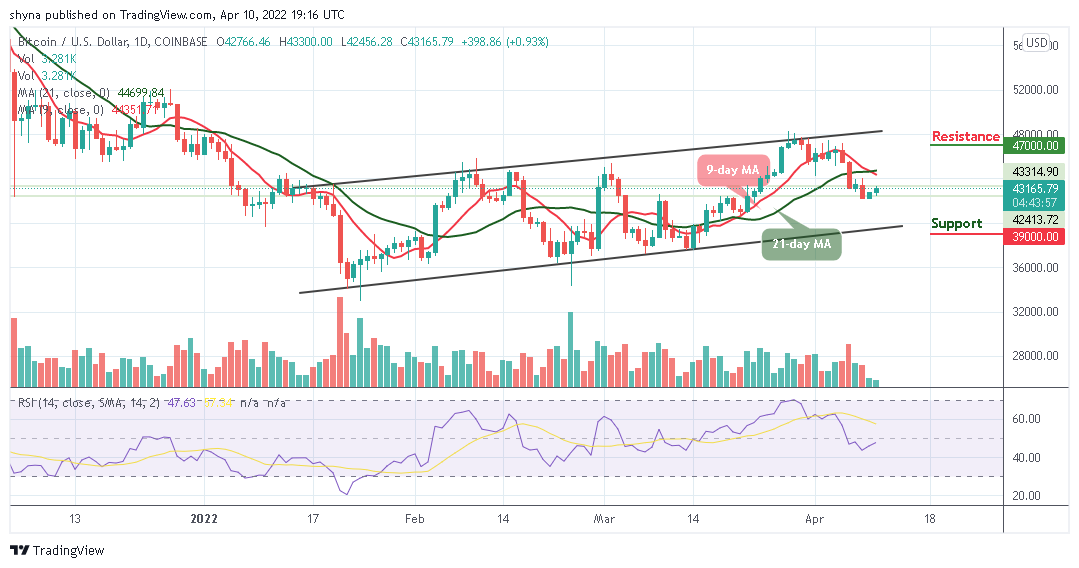
BTC/USD Long-term Trend: Ranging (Daily Chart)
Key levels:
Resistance Levels: $47,000, $49,000, $51,000
Support Levels: $39,000, $37,000, $35,000
BTC/USD is trading at the $43,165 resistance level but still below the 9-day and 21-day moving averages to touch the daily high at $43,300. For the past few days, the Bitcoin price has been towards the south, and in the context of this; an upward movement towards the resistance level of $45,000 is expected.
Bitcoin Price Prediction: Will BTC Break Above $45,000 Resistance Level?
If the Bitcoin price can continue the upward movement and probably cross above the 9-day and 21-day moving averages, it is likely for the market price to touch the $45,000 level. Once this happens, this is where traders should expect buyers to fight for a further rise in the market. Meanwhile, the purpose of this movement is to provide a resistance level that is close to $46,000 as the technical indicator Relative Strength Index (14) moves to cross above 50-level.
Technically, BTC/USD may experience a quick retracement or sell-off just in case it touches the crucial $42,000 level, but if not; traders may see additional resistance levels of $47,000, $49,000, and $51,000. On the downside, if the market decides to fall, the Bitcoin price could fall below the lower boundary of the channel, and if that support fails to hold the sell-off, BTC/USD could see a further decline towards the support levels of $39,000, $37,000, and $35,000.
BTC/USD Medium-Term Trend: Ranging (4H Chart)
On the 4-hour chart, traders expect the coin to gain the lost momentum and could trade above $43,000. On the contrary, if the selling pressure still exists and holds the coin not to being able to move towards the upper boundary of the channel, the $41,000 and below may come into play.
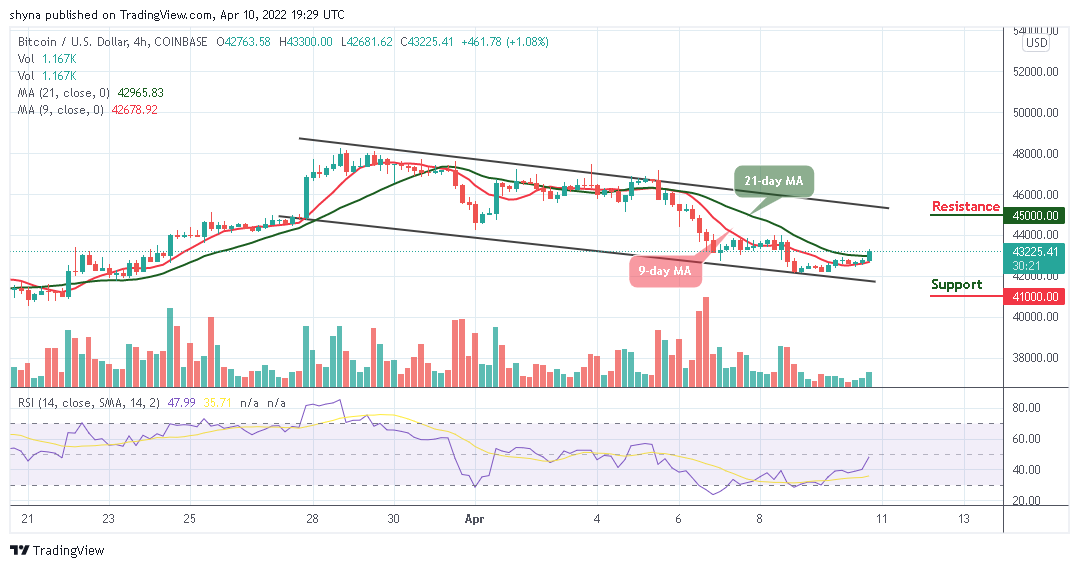
However, in as much as the buyers keep pushing the price above the 9-day and 21-day moving averages, traders may expect a strong bullish movement that could hit the resistance at $45,000 and above. Meanwhile, the technical indicator Relative Strength Index (14) moves to cross above 50-level, suggesting that more bullish signals may come into focus.
Looking to buy or trade Bitcoin (BTC) now? Invest at eToro!
68% of retail investor accounts lose money when trading CFDs with this provider
Read more:
- How to buy Bitcoin
- How to buy Cryptocurrency
Powered by WPeMatico