Bitcoin Price Prediction: BTC/USD Retraces Below $46,000
Bitcoin Price Prediction – April 4
The Bitcoin price prediction indicates bearish momentum as the con fails to cross above the 9-day moving average.
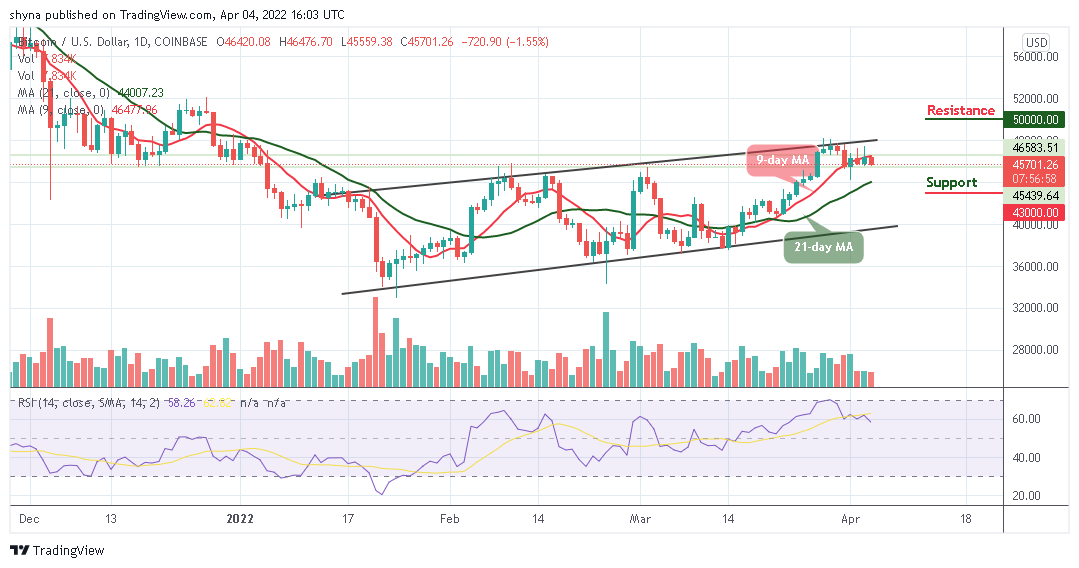
BTC/USD Long-term Trend: Ranging (Daily Chart)
Key levels:
Resistance Levels: $50,000, $52,000, $54,000
Support Levels: $43,000, $41,000, $38,000
At the time of writing, BTC/USD is hovering at $45,701. There have been instances when BTC touches the low of $45,559 to sustain the bearish price action. At the time of writing, the path of least resistance is still downwards, and the daily chart shows that the formation of a bearish may come into focus.
Bitcoin Price Prediction: BTC Fails at Crucial Resistance
At the time of writing, the bulls are struggling in keeping the Bitcoin price above the 9-day and 21-day moving averages but the price is currently dropping below the 9-day MA. BTC/USD has been suffering since the European session as the technical indicator Relative Strength Index (14) crosses below the 60-level. This could mean that the King coin is not yet ready for the upside.
On the upside, recovery may not come easy as the coin would have to cross above the 9-day moving average. Meanwhile, a sustainable move above this barrier may locate the resistance level of $47,000, which may allow for an extended recovery towards the potential resistance levels at $50,000, $52,000, and $54,000. However, an increase in selling pressure across the market could bring the Bitcoin price towards the supports at $43,000, $41,000, and $39,000.
BTC/USD Medium-Term Trend: Bullish (4H Chart)
The Bitcoin price is trading below the 9-day and 21-day moving averages on the 4-hour chart. However, if the price breaks above the moving averages, it could face the upper boundary of the channel. Meanwhile, higher resistance would be located at the resistance level of $46,000, and as the technical indicator Relative Strength Index (14) prepares to move above 50-level, the king coin may hit the resistance level of $47,000 and above.
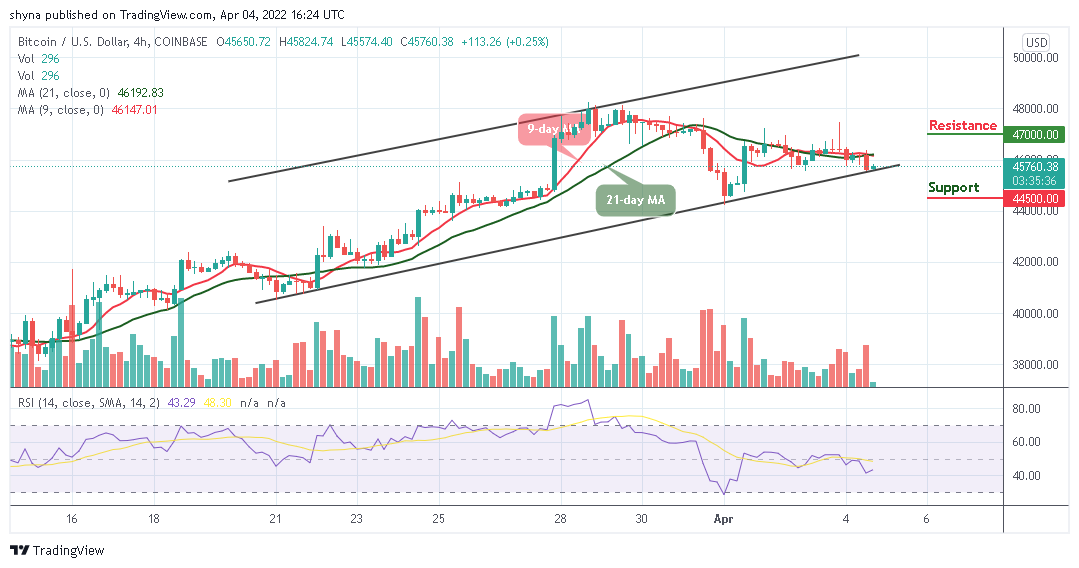
On the other hand, if the bearish movement increases, the support level of $45,000 may not be able to hold the selling pressure, and BTC/USD is likely to fall to the support level of $44,500 and below if the price crosses below the lower boundary of the channel.
Looking to buy or trade Bitcoin (BTC) now? Invest at eToro!
68% of retail investor accounts lose money when trading CFDs with this provider
Read more:
- How to buy Bitcoin
- How to buy Cryptocurrency
Powered by WPeMatico