Solana Price Prediction for Today, May 25: SOL Stands Feeble in a Range
Solana Price Prediction – May 25
The market operations between Solana and the US fiat currency show the crypto’s price stands feeble in a range. There has been no positive signal to negate the depression as the base trading instrument features around $48 with a 2.56 percentage rate negative.
Solana (SOL) Statistics:
SOL price now – $48.32
SOL market cap – $16.4 billion
SOL circulating supply – 339.26 million exactly
SOL total supply – 511.6 million
Coinmarketcap ranking – #9
SOL/USD Market
Key Levels:
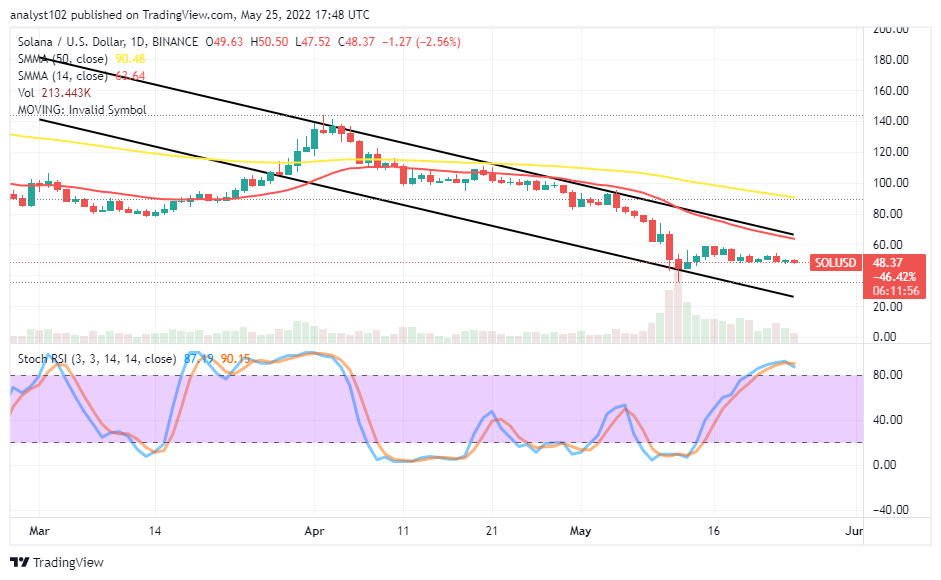
Resistance levels: $60, $70, $80
Support levels: $30, $20, $10
SOL/USD – Daily Chart
The daily chart reveals the SOL market activity against the US Dollar stands feeble in a range. That signifies an uneasy situation to have a smooth running to the upside from the current trading pace of the market. The 14-day SMA trading indicator is over the current trading spot beneath the 50-day SMA. The Stochastic Oscillators are in the overbought region, appearing to cross back lines southbound within. That denotes some selling forces are piling up presently in the market.
Will there be a prolonged ranging situation in the SOL/USD market operations?
It has been that the SOL/USD market operations are on to losing positions to the downside in a gradual process as the crypto-economic price stands feeble in a range. Price may prolong moving in a range basically between $60 and $40 while the actions from the two market movers tend not to exert force into a definite direction afterward. Buyers may have to exercise patience toward having a decent lower-trading outlook before considering launching a buying order to support the principle of price action entry.
On the downside of the technical analysis, it established that the main resistances point the SOL/USD market bears can reproach a downing motion around the trend line of the 14-day SMA at around the $60 resistant-trading level. The gravitational strength possesses the possibility of declining under a bearish setting around the value line mentioned earlier. The base crypto, likely, won’t survive spiking against the resistance overhead of the smaller SMA.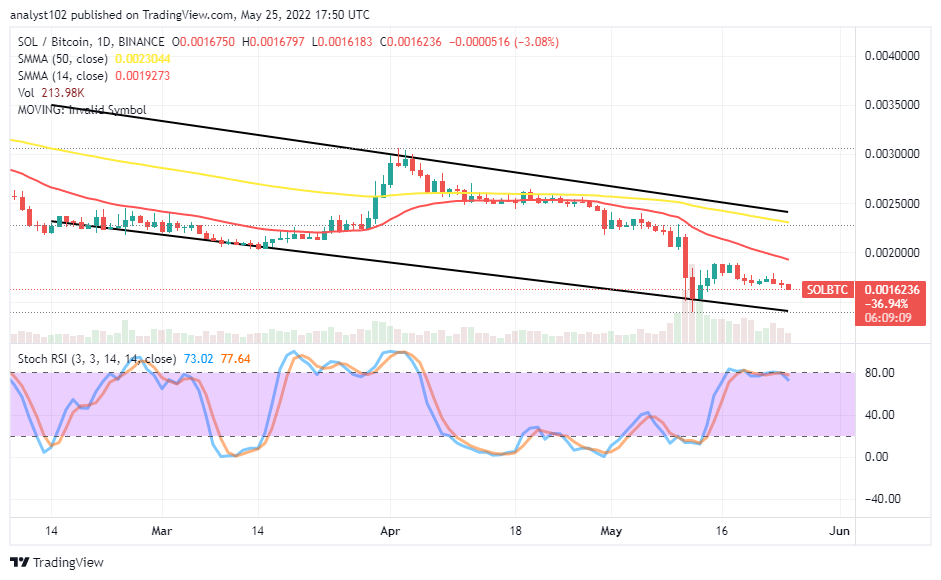
SOL/BTC Price Analysis
Solana still features lowering at a lower-trading zone against Bitcoin’s trending ability over time. The 50-day SMA indicator is above the 14-day SMA indicator. And they are within the bearish channel trend lines, bending southward within to solidify the downward-trending motion still valid. The Stochastic Oscillators are around the 80 range, moving in a consolidation manner. A chain of lower lows has resumed featuring to denote a long-term recovery movement.
Looking to buy or trade Solana (SOL) now? Invest at eToro!
68% of retail investor accounts lose money when trading CFDs with this provider.
Read more:
- How to buy cryptocurrency
Powered by WPeMatico