Uniswap Price Analysis for 1st of October: UNI/USD’s Uptrend May Be Ending Too Soon
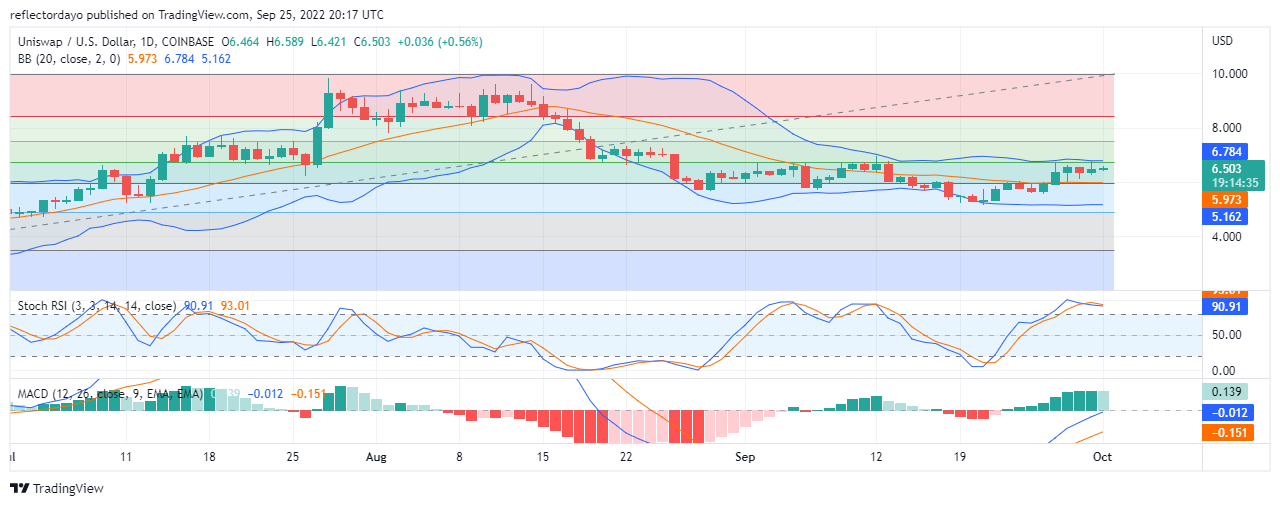
It can be observed from the UNI/USD market in recent times (within September) that the market keeps forming resistance at around the $6.654 price level. But, this resistance is lower in comparison to the resistance the market formed after a UNI/USD uptrend in August which was around the $9.261 price level. This indicates that the market is not performing as high as it did before.
Uniswap Market Price Statistic:
- UNI/USD price now: $6.491
- UNI/USD market cap: $4,947,434,821
- UNI/USD circulating supply: 762,209,327
- UNI/USD total supply: 1,000,000,000
- UNI /USD coin market ranking: #17
Key Levels
Resistance: $6.784, $7.000, $7.5000
Support: $6.0000, $5.5000 $5.0000
Buy Uniswap Now
Your capital is at risk
Uniswap Market Price Analysis: The Indicators’ Point of View
When we look at the price actions on the chart, from the 21st of September to the 28th of September, those bullish candlesticks were not as strong as to have quickly sent the RSI line into the overbought zone (according to the RSI indicator). This might be an indication that the uptrend is not going to last because the selling pressure is beginning to increase.
The MACD indicator, however, still has room for more bullish or uptrend performance. The histograms are still showing that the market is still bullish although the last three histograms that represent the three days’ trading sessions are of equal height. That also can be used to substantiate a trend reversal. But the two MACD lines are still in the below zero point trying to cross up above into the positive market zone.
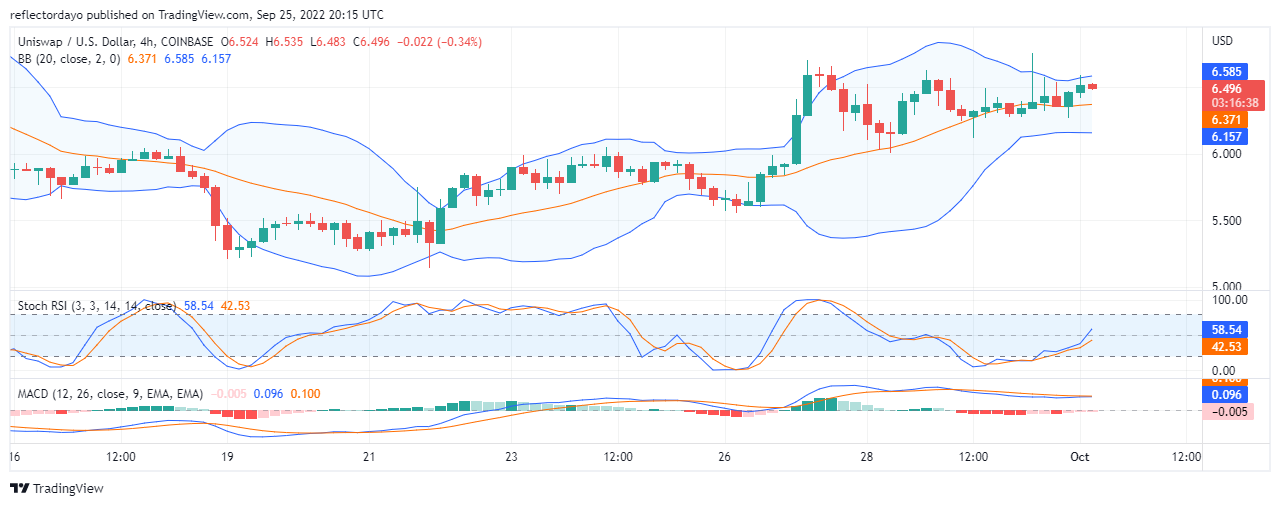
Uniswap 4-Hour Chart Outlook: Uptrend market
However, in this timeframe, the market is in the upper zone of the RSI indicator trying to rise to an upward position in an almost vertical line formation. This uptrend not yet reflected in the bigger timeframe in this analysis. But looking at the momentum of the RSI line, soon it will reach the overbought zone and, as a result of this, the bullish move may not even reflect into the bigger timeframe after all.
But the MACD indicators are still moving slightly below level zero although MACD line has now touched the signal line, it is yet to cross it. If it crosses it, the indicator will confirm the bullish recovery.
Tamadoge – Play to Earn Meme Coin

- Earn TAMA in Battles With Doge Pets
- Maximum Supply of 2 Bn, Token Burn
- Now Listed on OKX, Bitmart, Uniswap
- Upcoming Listings on LBank, MEXC
Powered by WPeMatico