Polkadot Price Prediction for Today, May 19: DOT Hasn’t Stopped Declining
Polkadot Price Prediction – May 19
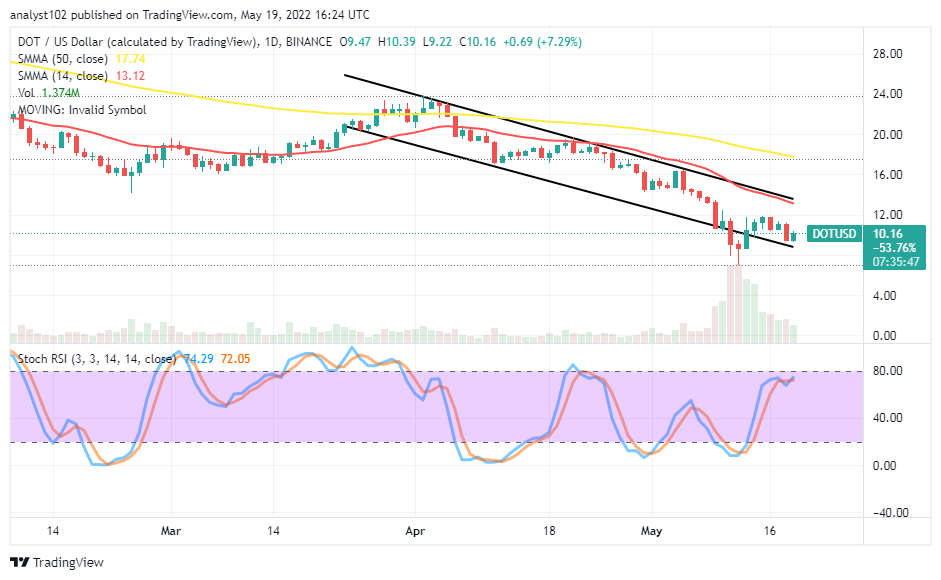
There has been a continued situation of failing striving efforts in the DOT/USD market activities over a long-term session as the crypto-economic price hasn’t stopped declining. As of writing, the price is trading around $10 at 7.29% positives.
Polkasot (DOT) Stastics:
DOT price now – $10.15
DOT market cap – $10.1 billion
DOT circulating supply – 120.8 million
DOT total supply – 1.1 billion
Coinmarketcap ranking – #11
DOT/USD Market
Key Levels:
Resistance levels: $12, $14, $16
Support levels: $8, $6, 44
GMT/USD – Daily Chart
The daily chart reveals the DOT/USD market hasn’t stopped declining since the bearish trading cycle resumed until now. The upper bearish trend line is drawn southward alongside the smaller SMA trading tool. The 14-day SMA indicator is below the 50-day SMA indicator. The Stochastic Oscillators have moved northbound from the oversold region, trying to point to the north side closely beneath the range of 80.
Where is the resistant spot to the DOT/USD market presently?
The resistant trading spot of the DOT/USD market can observe around the points of $12 and $14 in the long-term run as the crypto trade hasn’t stopped declining. Upward momentum gathering at the current trading value-line lacks an ideal force to push sustainably. As it is now, long-position takers might need to stay off the trading for a while until the price experiences an oversold condition before considering a buying order.
On the downside of the technical analysis, as it has envisaged, selling pressure may re-surface around the smaller SMA trend line that involved the $12 and $14 resistance levels. The $8 support level is the critical line against seeing more downs. A breach of the point to the south side may rise to a further fearful sell-off situation. While in the meantime, the current trading pace portends a chance for an ideal investment time.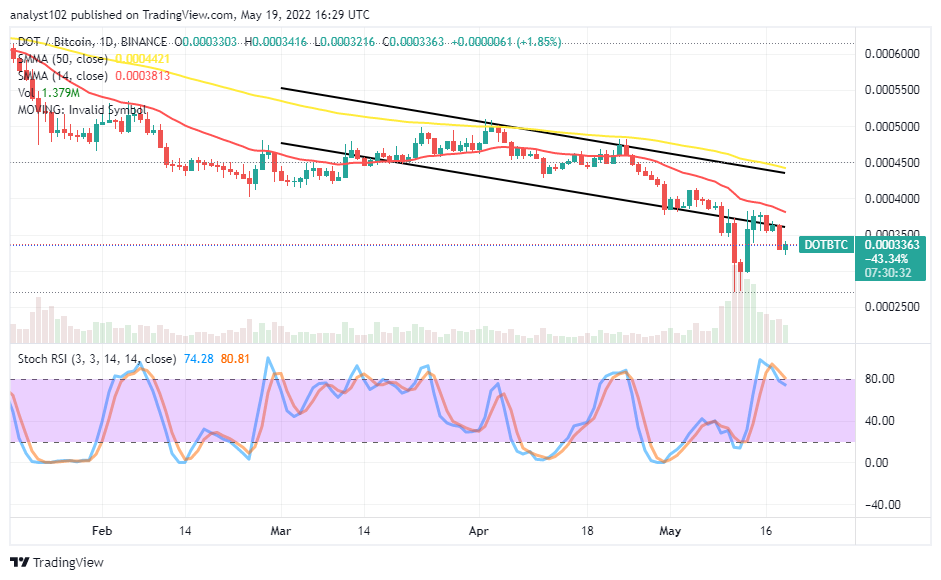
DOT/BTC Price Analysis
In comparison, Polkadot is still trying to push for a stance against Bitcoin. The cryptocurrency pair market hasn’t stopped declining as differential candlesticks have been forthcoming underneath the trend lines of the SMAs. The 14-day SMA trading indicator is beneath the 50-day SMA trading indicator. The Stochastic Oscillators are in the overbought region, trying to bend southbound against the range of 80. The verdict states the base crypto tends to lose some stances to its counter crypto.
Looking to buy or trade Polkadot (DOT) now? Invest at eToro!
68% of retail investor accounts lose money when trading CFDs with this provider.
Read more:
- How to buy cryptocurrency
Powered by WPeMatico