Litecoin Price Prediction for Today, May 19: LTC May Not Spring Up Soon
Litecoin May Not Spring Up Soon – May 19
Some indications have surfaced in the LTC/USD market activities that the crypto-economic may not spring up soon from its lower-trading spot. The present trading line of the price is around $67, maintaining a 2.25 percentage rate positive.
Litecoin (LTC) Statistics:
LTC price now – $66.48
LTC market cap – $4.7 billion
LTC circulating supply – 70.3 million
LTC total supply – 84 million
Coinmarketcap ranking – #19
LTC Trade
Key Levels:
Resistance levels: $75, $95, $115
Support levels: $50, $40, $30
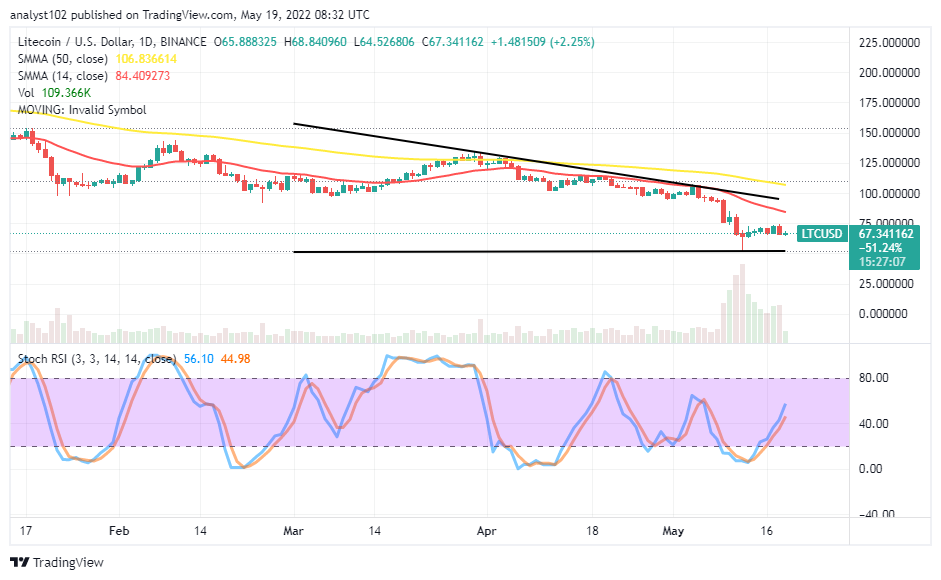
LTC/USD – Daily Chart
The daily chart exhibits that the LTC/USD market may not spring up soon as there has been a line of smaller-low candlesticks tightly beneath the $75 resistance level. The 14-day SMA indicator is underneath the 50-day SMA indicator. The horizontal line drawn at the $50 support level is to help ascertain the critical point toward getting more lows to cause a panic sell-off. The Stochastic Oscillators have moved northbound from the oversold region to reach the range; of around 55.
Will the LTC/USD market go down more beneath the $75 resistance level in the near time?
The LTC/USD market may hold operations beneath the $75 resistance level in a range-moving mode. And it is equally observed that the crypto-economic price may not spring up soon away from being under depression below the trading indicator trend lines. Nevertheless, buying opportunities may generate in the course of the market trying to push down for getting support in a deep-shallow trading zone.
On the downside of the technical analysis, the LTC/USD market short-position takers have almost exhausted the downward-trending force as there has been a quick rebounding motion around the $50 support level about a couple of days back. On the contrary, the reading of the Stochastic Oscillators suggests the crypto’s pushing catalyst against the US Dollar still falls within the pace of struggling to re-energize.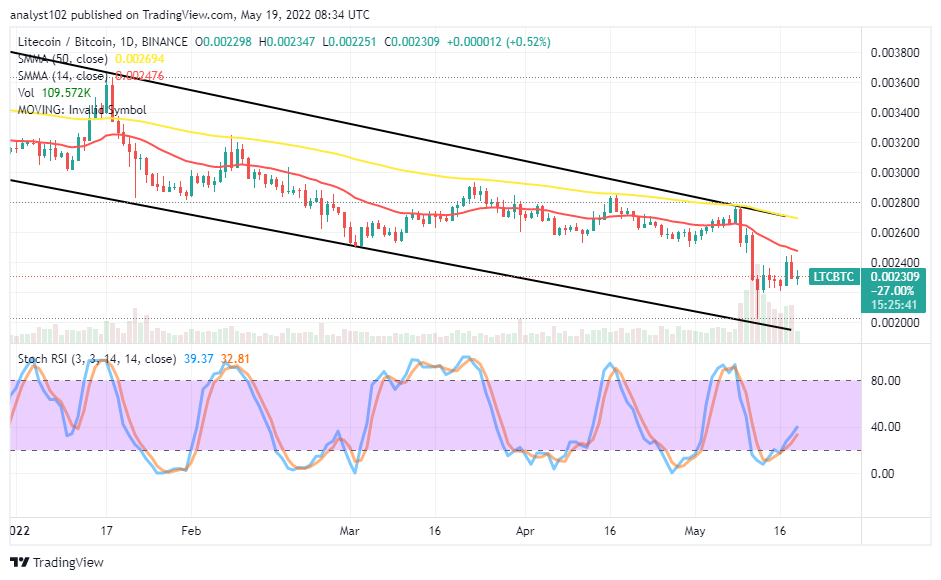
LTC/BTC Price Analysis
In comparison, Litecoin is trading at a lower base spot against Bitcoin, far below the trend lines of the SMAs. The 14-day SMA indicator is above the 50-day SMA indicator. The cryptocurrency pair trade may not spring up soon as variant candlesticks converge below the smaller SMA. But, there is still a space the price can push further to the downside to get to the lower bearish channel trend line. The Stochastic Oscillators have slantingly positioned from the oversold region against some range points, closely up to 40. That probably signifies the base crypto may not be pushing for a recovery over the trending force of the counter crypto in the near sessions.
Looking to buy or trade Bitcoin (BTC) now? Invest at eToro!
68% of retail investor accounts lose money when trading CFDs with this provider.
Read more:
- How to buy Litecoin
- How to buy cryptocurrency
Powered by WPeMatico