Ethereum Price Prediction for Today, May 18: ETH Is Hovering at $2,000
ETH Is Hovering at $2,000– May 18
The ETH/USD financial record shows the crypto-economic market is hovering at $2,000 presently. Price trades in the values of $2,108 and $2,030 at a negative percentage rate of 2.43.
Ethereum (ETH) Stastics:
ETH price now – $2,045.20
ETH market cap – $247.2 billion
ETH circulating supply – 120.8 million
ETH total supply – 120.8 million
Coinmarketcap ranking – #2
ETH Is Hovering at $2,000: ETH Market
Key Levels:
Resistance levels: $2,250, $2,500, $2,750
Support levels: $1,750, $1,500, $1,250
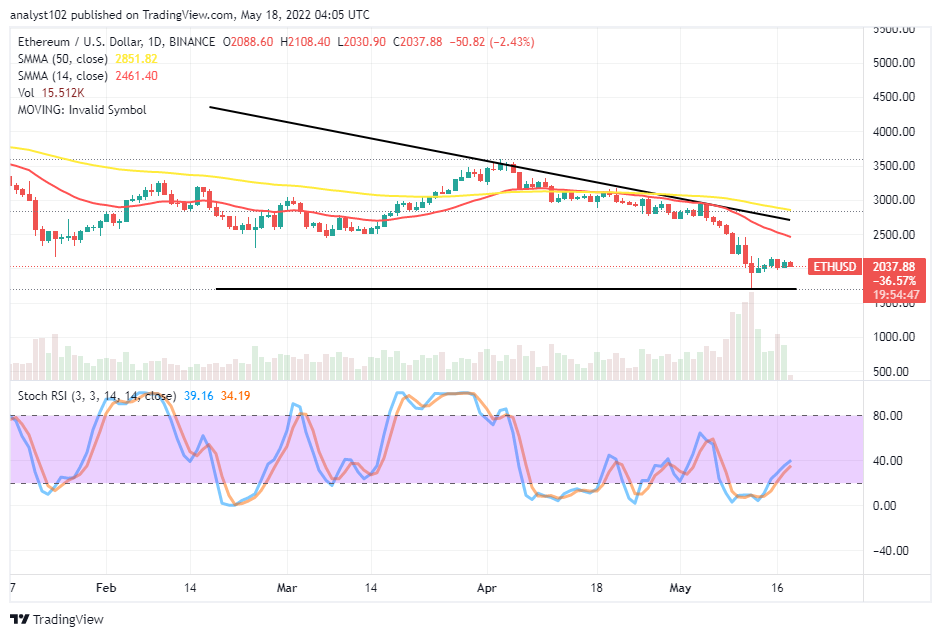
ETH/USD – Daily Chart
The daily chart reveals the crypto-economic market lowers, hovering at $2,000. The horizontal line drew at the $1,750 support level to serve as the baseline to get decent upswings while the trade tends to drop from its current trading spot. The 14-day SMA indicator is underneath the 50-day SMA indicator. The Stochastic Oscillators are in the 40 range, crossing from the oversold region.
Will the ETH/USD market lose strength at the $2,000?
The ETH/USD market may lose strength at the $2,000 level if bulls fail to pull up the energy to breakout past the value line in the near term. Being as it is, ETH trade is hovering around the value line. The market movers are yet to decide on the next direction to push. While that assumption is holding, long-position placers may have to concentrate on the outcome of the Stochastic Oscillators, giving an oversold region coupling with the emergence of bullish candlesticks from a lower-trading zone before deciding to take on a buying order.
On the downside of the technical analysis, the ETH/USD market short-position takers may have the advantage of presumed falling pressures to drive back the price to the south side. They needed to apply a proper money management principle on any sell order position beneath the $2,250 resistance line. A further downward push against the $1,750 support may not sustainably hold in the long-term run.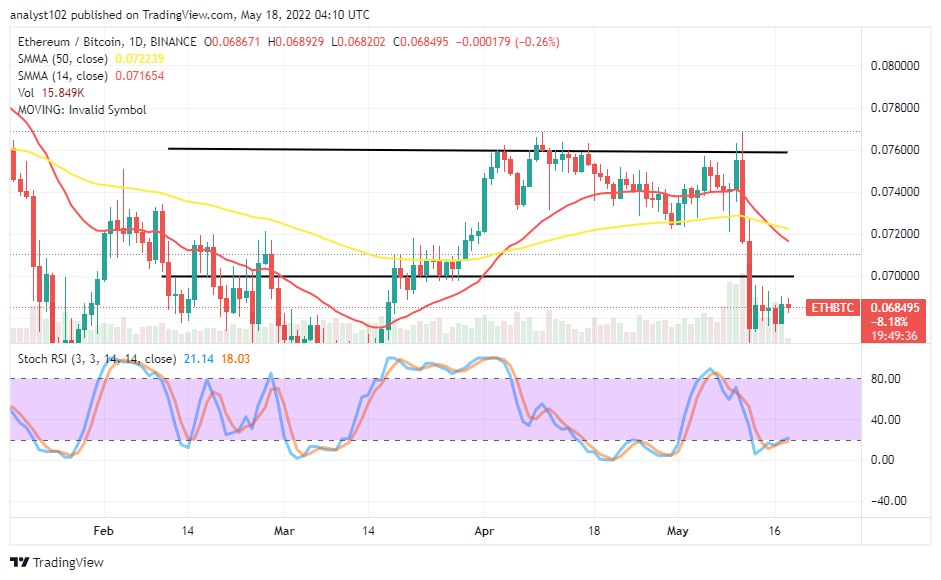
ETH/BTC Price Analysis
Ethereum has been downing below the lower range line drawn over time. The cryptocurrency pair price is hovering underneath the SMAs. The 14-day SMA indicator has intercepted the 50-day SMA indicator to the south side with the range-bound zones. The Stochastic Oscillators have moved down into the oversold region, trying to start a consolidation-moving manner. A set of variant candlesticks having top shadows has featured beneath the lower range line to signify the base crypto wallows in a falling pressure against the countering crypto.
Looking to buy or trade Bitcoin (BTC) now? Invest at eToro!
68% of retail investor accounts lose money when trading CFDs with this provider.
Read more:
- How to buy Ethereum
- How to buy cryptocurrency
Powered by WPeMatico