Ethereum Price Prediction for Today, June 27: ETH Slacks in Energy
ETH Holds in a Range – June 27
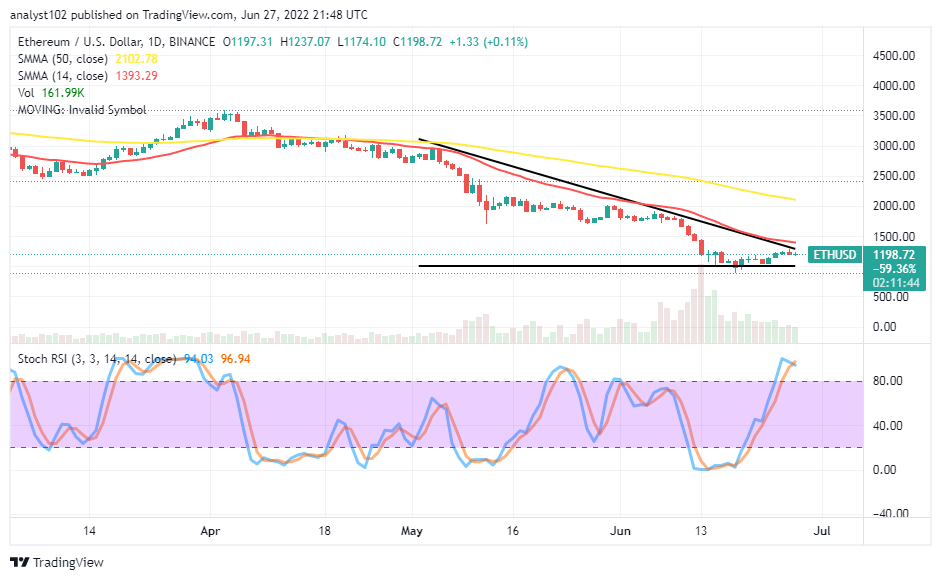
It currently witnesses that the Ethereum slacks in energy, trading against the market purchasing power of the US Dollar. The trading outlook, as of writing, shows a minimal positive percentage rate of 0.11, featuring between $1,237 and $1,174 value lines.
Ethereum (ETH) Statistics:
ETH price now – $1,199.24
ETH market cap – $145.6 billion
ETH circulating supply – 121.3 million
ETH total supply – 121.3 million
Coinmarketcap ranking – #2
ETH Holds in a Range: ETH Market
Key Levels:
Resistance levels: $1,500, $1,750, $2,000
Support levels: $1,000, $800, $600
ETH/USD – Daily Chart
The daily chart showcases the Ethereum market operation slacks in energy as it trades against the US Dollar closely around the smaller SMA. The 14-day SMA trend line is underneath the 50-day SMA trend line. The horizontal line remains drawn at the $1,000 support level. The Stochastic Oscillators are in the overbought region. And they have closed the lines to indicate the market may be facing a pause in transaction activities.
What’s the present trading outlook for the ETH/USD market traders and investors?
As the Ethereum market operation slacks in energy against the US Dollar trade, the present trading outlook portends that it is likely to price drop for a revisit of the previous low if the depression force may not be forthcoming on a large format. The Stochastic Oscillators have suggested the gravitation to the upside has been gradually exhausted. That is a warning signal against re-launching new buying position orders. It would be necessary that long-position takers allow some pull-downs to give a pattern ideal for longing order while active moves attempt back upside afterward.
On the downside of the technical analysis, selling forces may resume beneath the resistances of $1,393 and $1,500. A pull-up may occur to test those resistances to get the market repositioned along the bearish path it has been maintaining through the 14-day SMA. The overall verdict remains that selling pressures may soon have their way back into the market. If the presumed downward-trending force has to sustain, the baseline at the $1,500 support will be at risk of potential breaching past to average a lower spot close $600 level in the long run.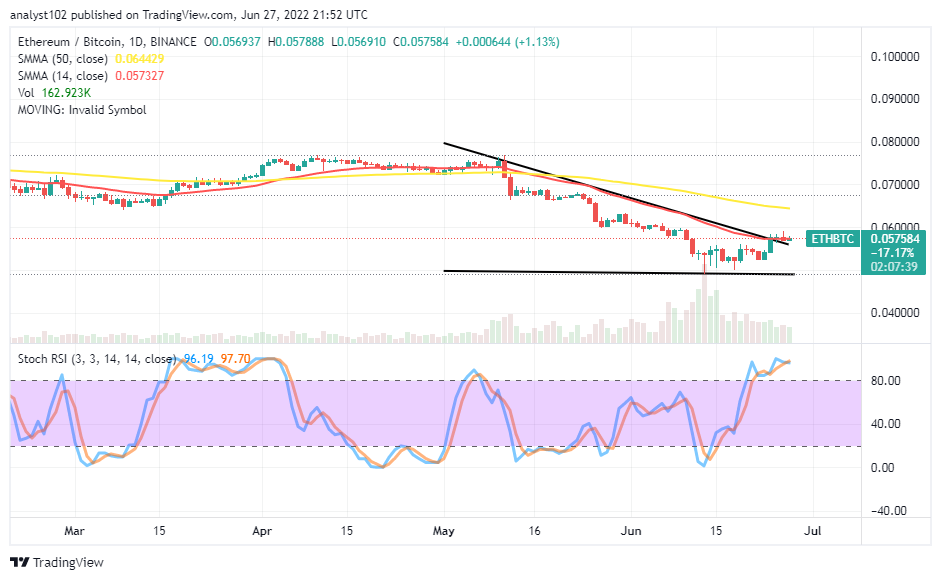
ETH/BTC Price Analysis
In comparison, Ethereum appears to be getting set to garner catalyst to push against the trending outfit of Bitcoin. The cryptocurrency pair slacks in energy to continue in the north direction presently. The 14-day SMA trading indicator is underneath the 50-day SMA indicator. And a set of candlesticks has emerged around the smaller SMA trend line, indicating a rejection signal. The Stochastic Oscillators are in the overbought region. The whole situation suggests the base crypto risk the possibility of losing back the stances to the counter-trading crypto.
Looking to buy or trade Bitcoin (BTC) now? In-Content Heroes link!
68% of retail investor accounts lose money when trading CFDs with this provider.
Read more:
- How to buy Ethereum
- How to buy cryptocurrency
Powered by WPeMatico