DYDX Price Analysis for 26th of September: DYDX/USD Finds Its Direction to the Upside
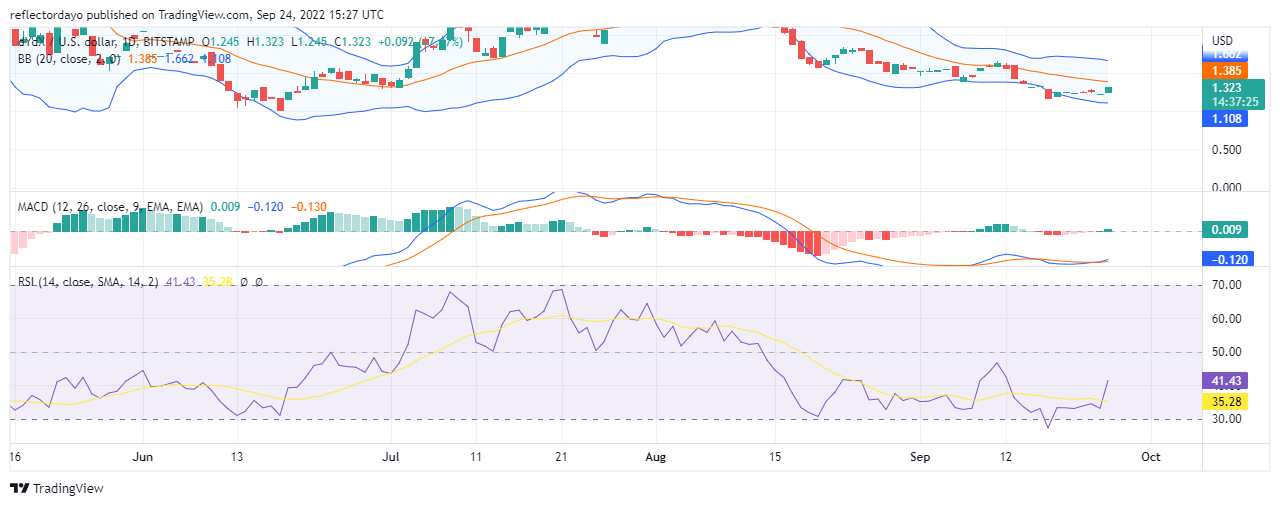
After a brief consolidation in the DYDX/USD market that came to an end on the 11th of August, the market began to trend downward for 10 days after which bulls’ attempt to push up the market failed and resulted in another sideway-ranging market. The market consolidating period portrays a very high level of indecision, but at some point sellers’ aggression made the market price fall. But the bearish move did not last for more than just a day on each of the occasions. However, In the market today, we see that bulls are making an impressive effort to push the price up. As the price is currently balanced at $1.323, there is still more land to cover if buyers will take today’s market into the bullish trend.
DYDX Market Price Statistic:
- DYDX /USD price now: $1.323
- DYDX/USD market cap: $ 86,708,495
- DYDX/USD circulating supply: 65,569,295
- DYDX/USD total supply:1,000,000,000
- DYDX/USD coin market ranking: #255
Key Levels
- Resistance: $1.50000, $2.0000, $2.5000
- Support: $1.0000, $0.50000, $0.25000
Buy DYDX Now
Your capital is at risk
DYDX Market Price Analysis: The Indicators’ Point of View
The market was static for 5 days. The buyers and sellers did not bid the price in any of the two market directions. But on the 23rd of September, we saw the sign of a very small market price pull – an attempt to break out from the ranging market. However, it was not until today that we begin to see a decisive market movement to an upper price level.
The MACD portrays a bearish market ranging below level zero of the Indicator. The MACD line is now rising above the signal line as the histogram height increases upward. The Relative Strength Index also confirms that the market is recovering from the bearish zone. Its RSI line is rising and is now at 41%. Similar to the indication of the MACD, the RSI line is below the 50% level of the indicator.
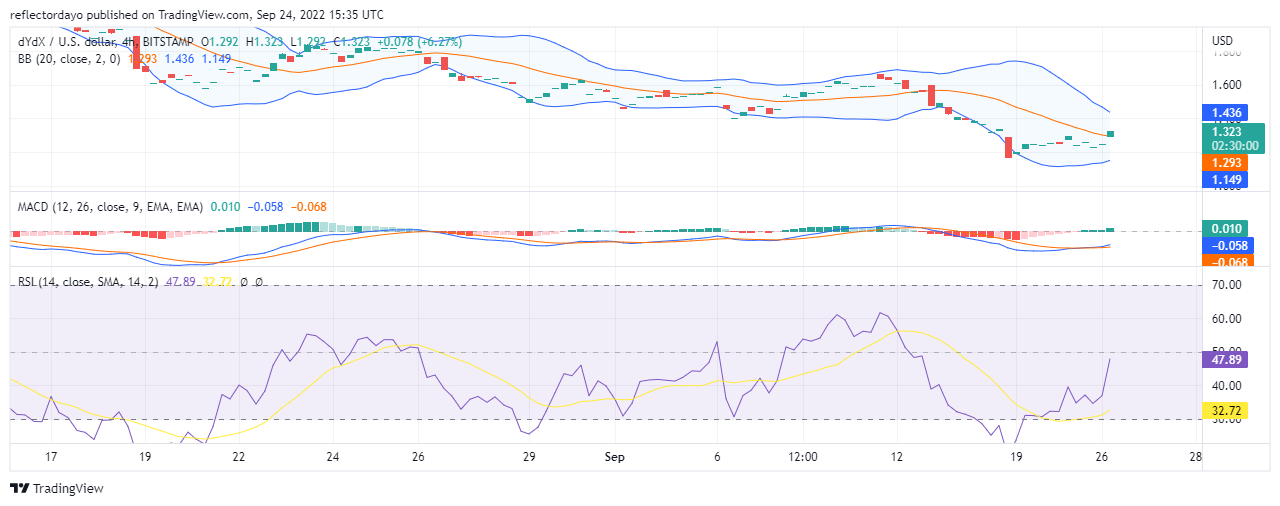
DYDX/USD 4-Hour Chart Outlook
The 4-hour timeframe is not much of a difference from the Daily chart timeframe. As we can see from the chart, one session is missing. The first trading session did not appear here on the chart. Buying activities only started in the third trading session. The candlestick that represents the third trading is very bullish. For now, we are not seeing selling activities in the market at all. The RSI and the MACD indications are quite similar to that of the daily session. The market is facing an upward direction, but the momentum is poor.
Tamadoge – Play to Earn Meme Coin

- Earn TAMA in Battles With Doge Pets
- Capped Supply of 2 Bn, Token Burn
- Presale Raised $19 Million in Under Two Months
- Upcoming ICO on OKX Exchange
Powered by WPeMatico