Bitcoin Price Prediction for Today, May 17: BTC May Retrace Below $30,000
The Bitcoin price prediction indicates bearish momentum as further upside was rejected during the European session.
Bitcoin Prediction Statistics Data:
- Bitcoin price now – $30,149
- Bitcoin market cap – $573.5 billion
- Bitcoin circulating supply – 19.0 million
- Bitcoin total supply – 19.0 million
- Bitcoin Coinmarketcap ranking – #1
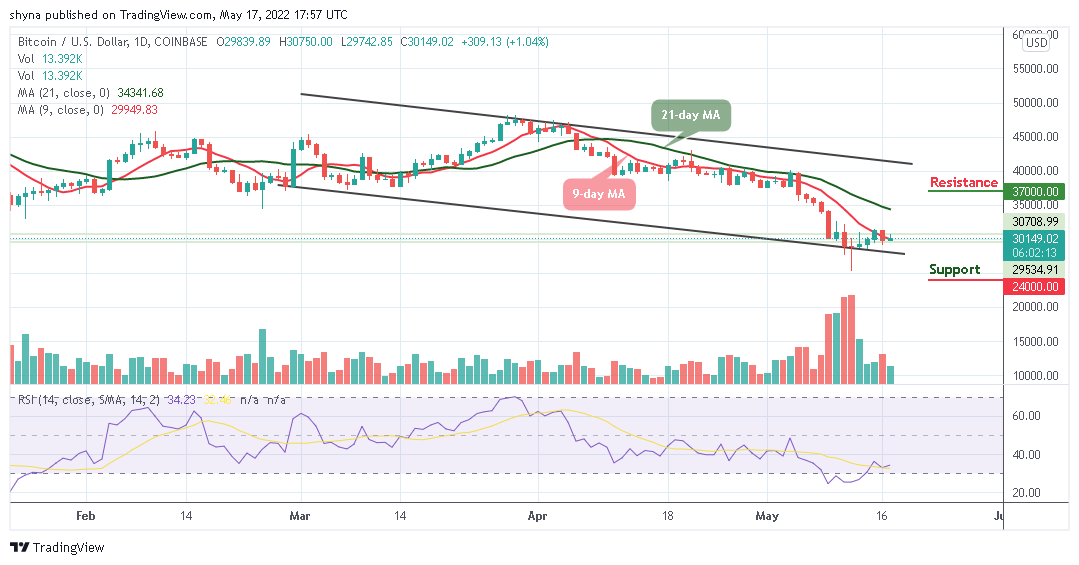
BTC/USD Long-term Trend: Bearish (Daily Chart)
Key levels:
Resistance Levels: $37,000, $39,000, $41,000
Support Levels: $24,000, $22,000, $20,000
At the time of writing, BTC/USD is hovering at $30,149, and there have been instances when BTC has exchanged hands below $30,000 sustaining the bearish price action is a downhill task. At the time of writing, the path of least resistance is still downwards, and the daily chart shows that the formation of a bearish may come to play.
Bitcoin Price Prediction: BTC Fails to Stay Above $30,000
According to the daily chart, the Bitcoin price is not yet ready for the upside as the Relative Strength Index (14) is still hovering below 40-level. This could mean that there may still be a room that could be explored by the bears as the Bitcoin price may continue to follow the downtrend in as much as the king coin remains below the 9-day and 21-day moving averages.
On the upside, recovery may not come easy as the support will have to be sorted for above the 9-day moving average. Meanwhile, a sustainable move above this barrier could be located at $33,000, which may allow for an extended recovery towards the resistance levels at $37,000, $35,000, and $33,000. However, an increase in selling pressure across the market could force the Bitcoin price towards a painful path and through various tentative supports at $24,000, $22,000, and $20,000.
BTC/USD Medium-Term Trend: Ranging (4H Chart)
On the 4-hour chart, the Bitcoin price is now trading within the 9-day and 21-day moving averages. BTC/USD has just survived crossing below $30,000 as the market is trying to recover from the bearish momentum. However, BTC/USD is likely to return to the bull market if the price breaks above the upper boundary of the channel. Meanwhile, higher resistance could be located at $33,500 and above while the technical indicator Relative Strength Index (14) moves above 50-level.
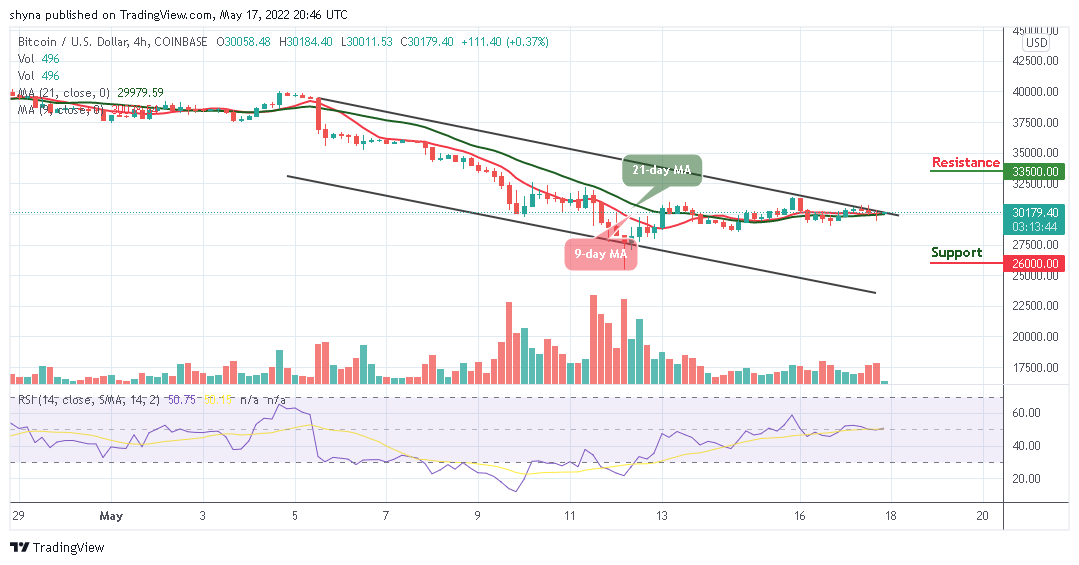
On the other hand, if the bearish movement steps back, the support level of $28,000 may not be able to hold the selling pressure. More so, BTC/USD is likely to fall to $26,000 and below if the price fall, and faces the lower boundary of the channel.
Looking to buy or trade Bitcoin (BTC) now? Invest at eToro!
68% of retail investor accounts lose money when trading CFDs with this provider
Read more:
- How to buy Bitcoin
- How to buy Cryptocurrency
Powered by WPeMatico