Bitcoin Price Prediction for Today, May 17: BTC May Downsize at $30,000
Bitcoin Price Prediction – May 17
An indication suggests that the BTC/USD market operations may downsize from $30,000 reading area. The crypto economy’s worth is now trading between $30,769 and $29,445 points at a minute of negative 0.60%.
Bitcoin (BTC) Stastics:
BTC price now – $29,780.10
BTC market cap – $565.9 billion
BTC circulating supply – 19 million
BTC total supply – 19 million
Coinmarketcap ranking – #1
BTC/USD Market
Key Levels:
Resistance levels: $32,500, $35,000, $37,500
Support levels: $27,500, $25,000, $22,500
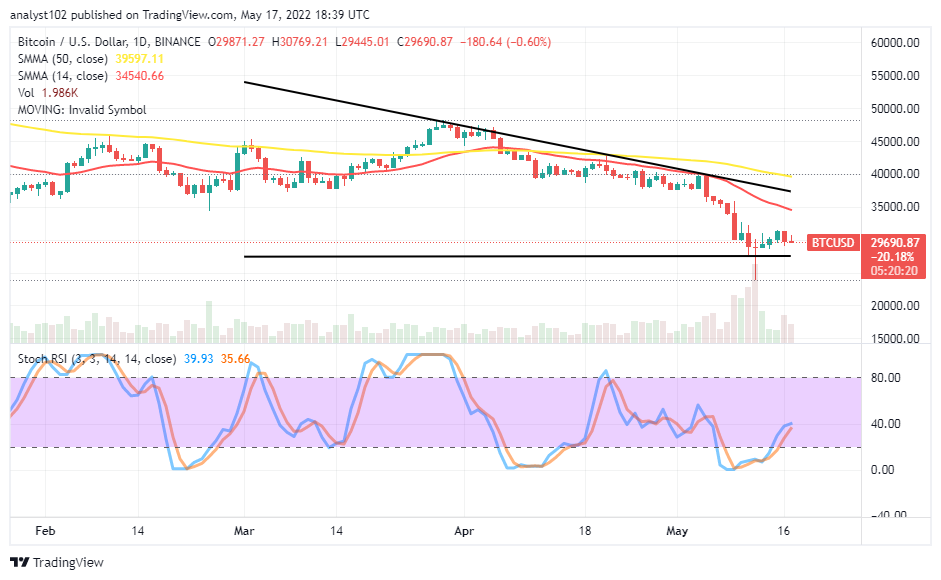
BTC/USD – Daily Chart
The daily chart showcases the BTC/USD market may downsize from $30,000 trading spot. The positioning of the SMA trend lines above the current trading area has shown that the market is yet far from pushing out of the risk of trading under depression. The 14-day SMA indicator is underneath the 50-day SMA indicator. The Stochastic Oscillators have moved northbound from the oversold region, attempting to cross their lines around the 40 range. That signifies the possibility of having a correction so soon.
Is it ideal to follow the trend as the BTC/USD market may downsize from $30,000?
A bearish candlestick has occurred on a less-active mote to suggest the possibility of having more swing lows in the following sessions. But, the motion to the downside might not be as aggressive as it featured recently, as there has been an indication that the BTC/USD market may downsize from $30,000 trading arena soon. Long-position takers are o be alert to any active rebounding move that can emanate from the declining movement afterward.
On the downside of the technical analysis, the BTC/USD market short-position takers have to keep their stances firmly at a maximal point underneath the $35,000 resistance level against any near future efforts to push to negate the bearish trading cycle. Joining the declining nature of the market at around $30,000 may generate profit for bears for a while, especially if the price tends to move in a less-active manner.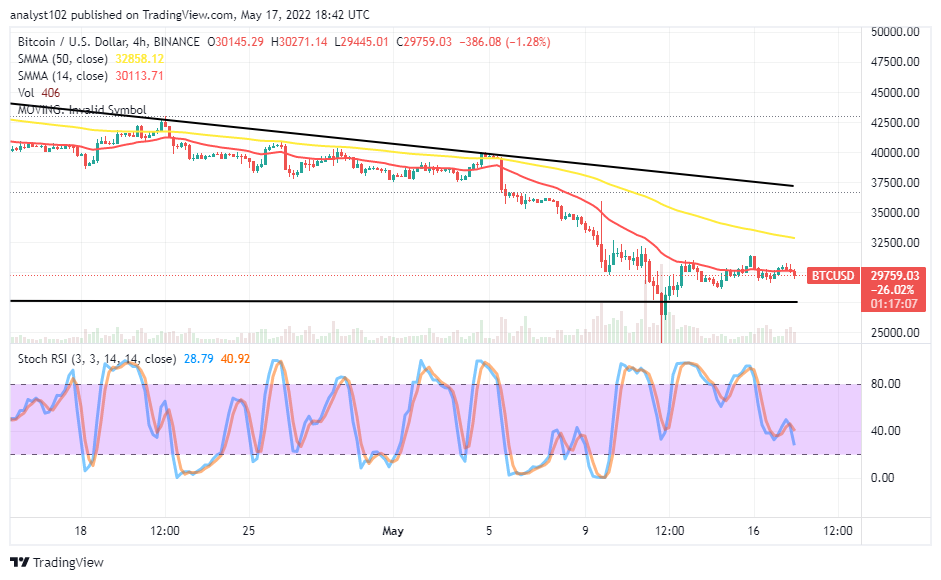
BTC/USD 4-hour Chart
The BTC/USD medium-term chart reveals the crypto economy may downsize at the $30,000 level. The smaller SMA is around the value line, witnessing variant candlesticks characterizing rejections. The 14-day SMA indicator is underneath the 50-day SMA indicator. The Stochastic Oscillators have moved southbound to the range of 40. And, they are still pointing to the downside direction to indicate that a falling force is in the prevalence of the crypto trade.
Looking to buy or trade Bitcoin (BTC) now? Invest at eToro!
68% of retail investor accounts lose money when trading CFDs with this provider.
Read more:
- How to buy Bitcoin
- How to buy cryptocurrency
Powered by WPeMatico