API3 Daily Price Prediction for the 18TH of August: API3/USD Bulls Are Becoming Weak
After the market went in favour of the bears in the past two days, the bulls are now trying to come back. But today’s API3/USD bullish market activities are not as impressive. We can now say that both the buying pressure and the selling pressure are weakening. And it is likely the price consolidates for some time. However, on a general outlook, with the considerable higher lows of the price activities on the chart, the general market behaviour is trending up.
API3/USD Price Statistic Data
- API3/USD price now: $2.30700000
- API3/USD market cap: $ 130,266,373
- API3/USD circulating supply: 56,547,601 API3
- API3/USD total supply: 113,912,052 API3
- API3/USD coin market cap rank: #173
Key Levels
- Resistance: $2.00262285, $2.22303594 $2.43343026
- Support: $1.95433295, $1.55873083, $1.67053143
Buy API3 Now
Your capital is at risk
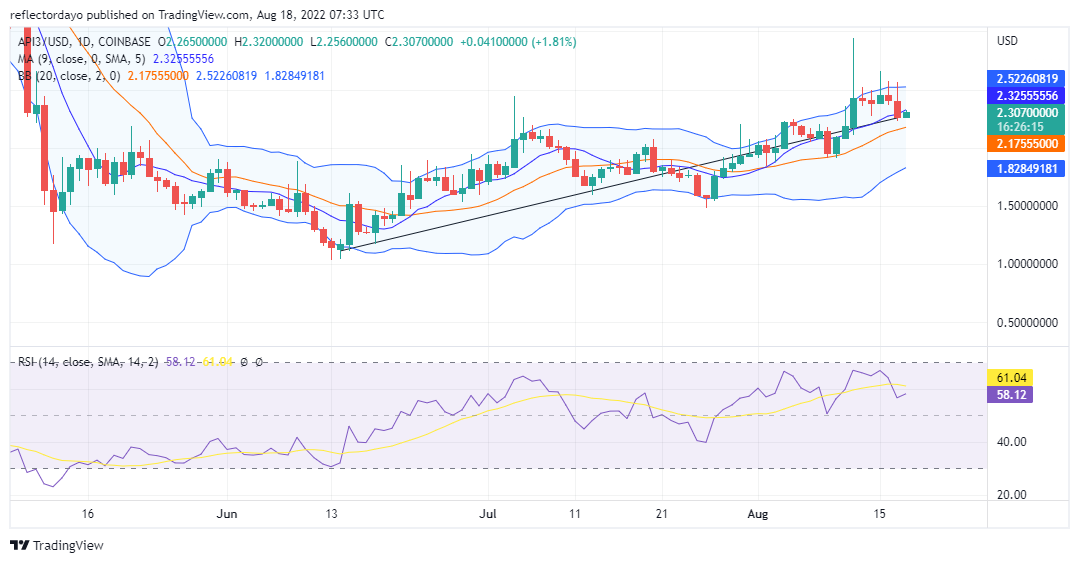
Price Prediction for API3: A Look at the Indicators
The market is considerably trending up despite the bearish activities. We can say this because the 9-day Moving Average line (being a faster moving average) goes almost together with the price actions. But, the 21-day moving average is below the price actions. That means an uptrend may resume soon. In the RSI indicator, the signal line (being the slower line) steadily rises and now measures at 61%. The RSI line (which is much faster) has moved erratically, but it is now retracing an upward direction. RSI line is measuring, in the uptrend section, a strength of 58.5%. It is likely the bull regain a hold on the market.
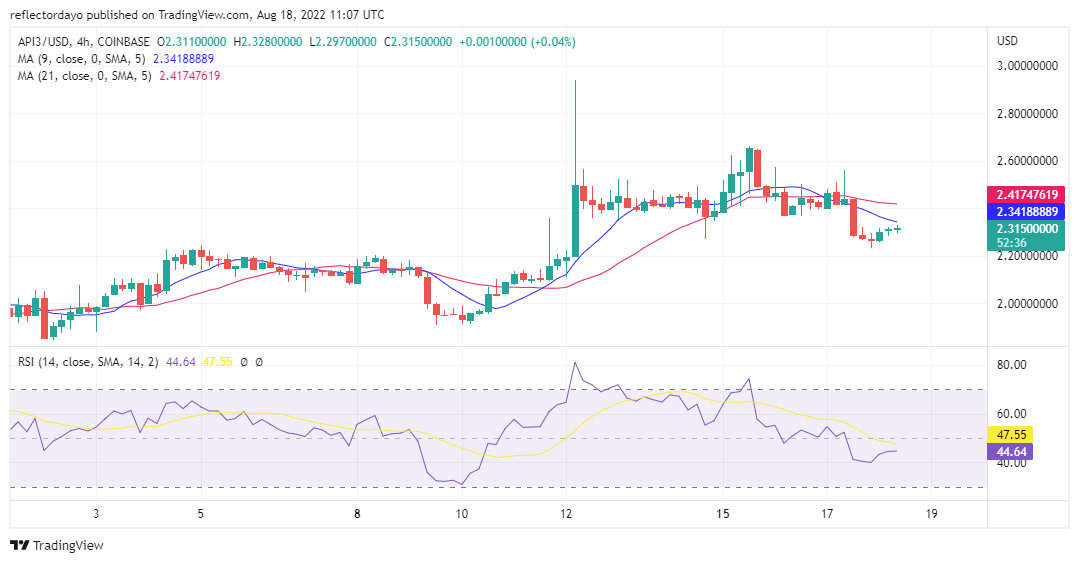
The API3/USD 4-Chart Outlook
Yesterday’s market was largely controlled by the bears. The last trading session for yesterday ended with a market deadlock. None of the two market forces could control the direction of the price for that period. That implies that the bears are becoming weaker. This resulted in today’s bullish market move. However, observing the second trading session, bulls also are faced with the same market indecision. This may be an indication of weakening bullish momentum. The RSI indicator measures weakness of 44% although it is retracing upward direction. But the signal line(which is slower than the RSI line) is falling. My prediction is that price might soon rally back to $2.42376096.
Related
- How to Buy Tamadoge
- Visit Tamadoge Website
Tamadoge – Play to Earn Meme Coin

- Earn TAMA in Battles With Doge Pets
- Capped Supply of 2 Bn, Token Burn
- NFT-Based Metaverse Game
- Presale Live Now – tamadoge.io
Powered by WPeMatico